By McClain Baxley
ATLANTA — Words can do a great job of telling a story, but by making
the words visual, the story can be told in a whole new way.
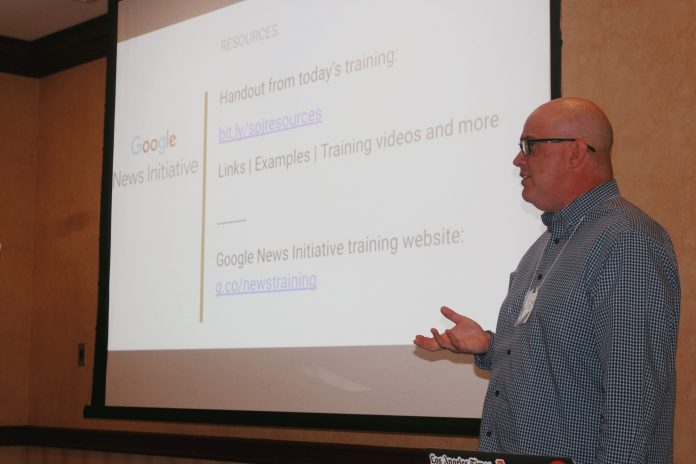
In Tuesday’s “Google Flourish and Mapping Exercises” workshop at the 2019 APSE Summer Conference in Atlanta, Mike Reilly taught how to make graphs and visuals using Google products. As a data and digital journalism professor at the University of Illinois-Chicago, Reilly has the opportunity to experience multiple Google software, including Google Flourish and Google My Maps.
“(Flourish) is a really nice graphics tool, with fun and unique
graphics and animations. It’s perfect for sports,” Reilly said.
“Sportsdata users can do some really incredible stuff with this.”
Reilly led a group of 40 in working an exercise with Google Flourish. The example of choice: NFC North 2018 QBR scores.
The goal of the exercise was to showcase how the QBR scores of the
four starting quarterbacks in the NFC North division moved up and down throughout the most recent season.
By dropping a premade spreadsheet into the website, Flourish
programmed it all and made the chart look colorful, clean and made it easy to visualize the QBR.
“We could plug this into a simple line chart, but by animating it, we
get to see the chaos that is the NFL season,” Reilly said. “You can
see a guy like (Chicago’s Mitch) Tribusky, a second-year quarterback
who had a pretty inconsistent season. It’s like watching a rubber ball
bounce.”
Once the group had a grasp on how to maneuver around the Flourish
software, Reilly moved on to the new beast of Google Mapping.
Google My Maps lets the user plug in locations and see where
they are in various ways.
The exercise utilized college bowl locations as the example, using
stadium locations, bowl names and type of turf.
Like in Flourish, there was a spreadsheet already filled out that
participants simply had to drop into the Maps software and the website
made the data look far more presentable.
“My Maps is good for spreadsheets with 1,000 words or less,” Reilly
said. “Something that you have at max a few hours to work on.”
Reilly made sure everyone understood the basics of Maps and Flourish
and offered other good tools journalists can use to make their words
come to life. He’s the founder of journaliststoolbox.com and
encouraged the group to check out the website for everything one might
need for digital journalism.


